Fitts’ Law Replication
By Vivek R. Shivaprabhu
In 1954, Paul M. Fitts modeled human psychomotor behavior by describing the phenomena of variability of a response as a function of response duration using information theory concepts. He introduced an index of difficulty of a movement which relates average values for amplitude, duration and variability of successive movements [1]. He proposed a speed-accuracy trade-off using a principle of motor control where activities done quicker can be less accurate than those activities done slower.
The Shannon formulation [2] (known for its resemblance to Shannon-Hartley’s channel capacity theorem) of Fitts’ Law is widely used as a cornerstone in user interface design, and HCI in general, was proposed by MacKenzie:
(1)
ID, in bits, is calculated from D, the distance to the target, and W, the effective width of the target. An important improvement was proposed by Fitts [3], where the target width (W) is replaced by an effective target width (We), which is computed from the standard deviation in the selection coordinates gathered over a sequence of trials for a particular D-W condition.
(2)
where SDx is the standard deviation of the end-point positions using observed end-point scatter data. Using effective width allows throughput to incorporate the spatial variability in human performance. It includes both speed and accuracy [2].
ISO 9241-9 establishes uniform guidelines [4] and testing procedures for evaluating computer pointing devices. The metric for comparison is Throughput, in bits per second (bits/s), which includes both the speed and accuracy of users' performance. The equation for throughput is Fitts’ Index of Performance except using an effective index of difficulty (IDe). Specifically,
(3)
where MT is the mean movement time, in seconds, for all trials within the same condition.
Using guidelines from ISO 9241-9:2000 an implementation of the Fitts’ Law was developed using vanilla Javascript (sans third party libraries and frameworks), using HTML5 canvas. The application serves as a physical illustration of how big targets at close distance can be reached faster than smaller targets that are farther away. This implementation takes the following inputs for the experiment:
The targets are presented to users in counter-clockwise order based on the selected sizes and distances, which are chosen in random order. For example, if the user chooses radii 10 and 20 and distances 100, 200, and 300, the target size-distances (W-D) are randomized.
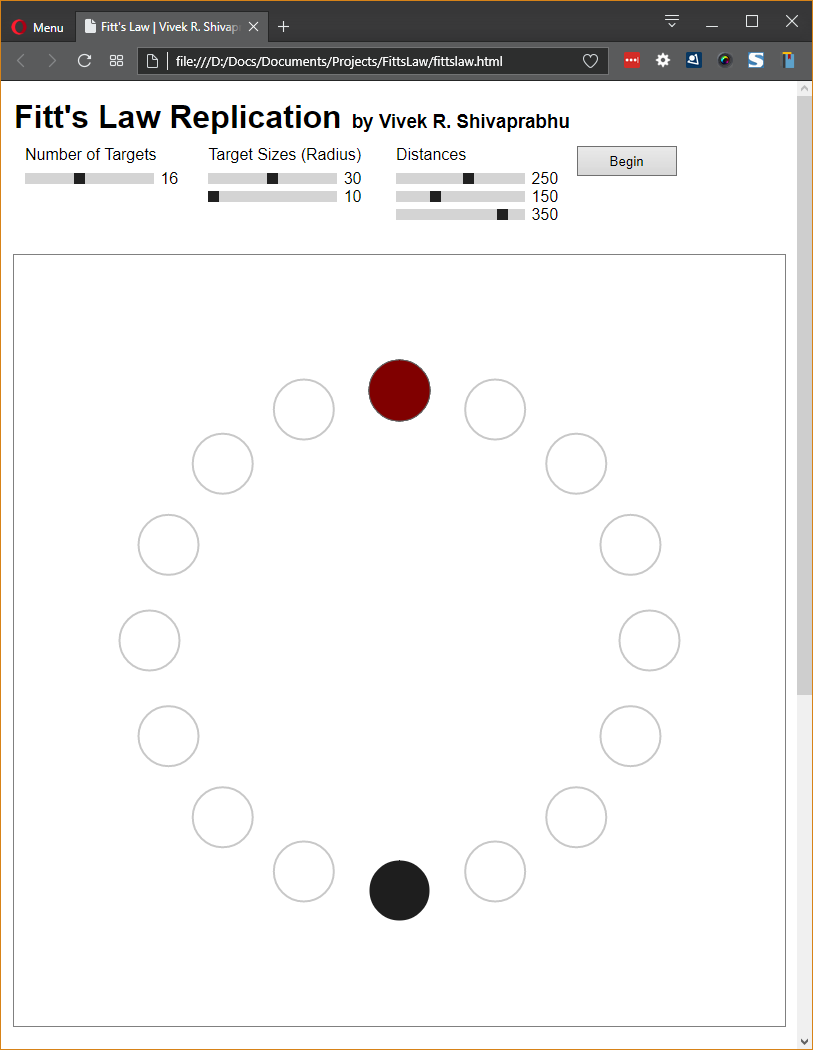
Figure 1. Screenshot of the application showing the options to select parameters and the user interface that allows the user to select targets.
For this experiment, to ensure consistency of data across multiple users, modality was restricted to laptop trackpad. All (three) instances of the experiment were conducted using the laptop’s built-in display, with similar posture and lighting.
The following values were measured:
During initial testing, it was heuristically observed that touch (using cell phone) was significantly faster using a mouse (on a desktop monitor), which was much faster than using the laptop trackpad. This makes sense intuitively, but is not used in understanding user behavior for this experiment.
For each W-D condition, average effective distance (De) is calculated from effective distance values, and effective width (We) is calculated by from the SD of the error-rates captured from the experiment, as shown in Equation (2). The index of difficulty (IDe) is calculated based on Equation (1). Mean time (MT) is gathered based on movement durations. Finally, throughput (TP) is calculated based on Equation (3). For the experiment with three users, we had 33 pairs of targets; we obtained the values as shown in Table 1.
W |
D |
De |
σ2 |
We |
IDe |
MT |
TP |
20 |
200 |
335.55 |
5.60 |
9.78 |
5.14 |
1.41 |
3.65 |
20 |
400 |
399.52 |
4.61 |
8.88 |
5.52 |
1.49 |
3.70 |
20 |
600 |
599.42 |
4.47 |
8.74 |
6.12 |
1.59 |
3.85 |
40 |
200 |
203.64 |
16.36 |
16.72 |
3.72 |
1.13 |
3.29 |
40 |
400 |
401.12 |
12.14 |
14.40 |
4.85 |
1.20 |
4.03 |
40 |
600 |
597.55 |
17.95 |
17.51 |
5.13 |
1.30 |
3.94 |
Table 1. Calculated average values for the six size-distance (W-D) conditions.
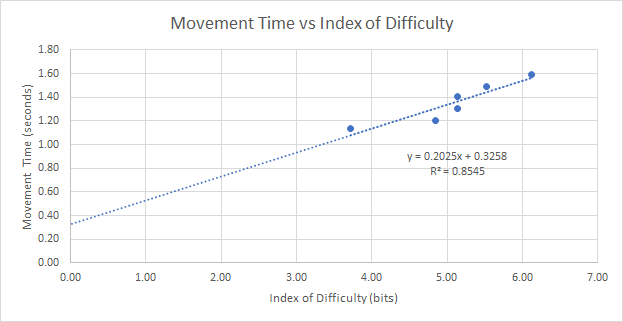
Figure 2. Plot of MT vs ID shows a 0.33 seconds intercept.
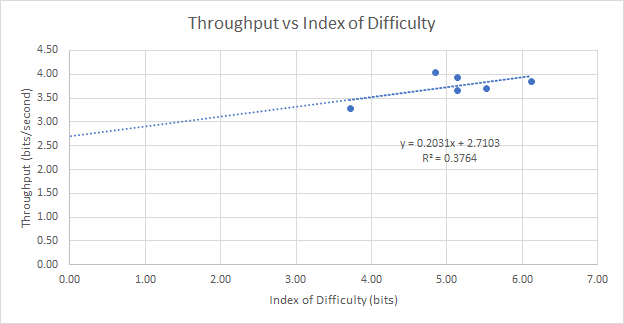
Figure 3. Plot of TP vs ID indicates that TP increases slightly with ID, which is counter-intuitive.
Average Movement Times and Throughputs are plotted against Index of Difficulty for each condition. With data from one user, throughput values seemed very erratic, but the slope seemed to indicate that throughput decreases as the index of difficulty. Movement time had a negative y-intercept; although impossible in a practical setting, this has been observed on several occasions.
As data from second and third users were added, the averages seem to coalesce close along a linear plot, thus increasing the R2 values proving a better goodness of fit. Having said that, the slope for throughput seems to now indicate that it increases slightly with index of difficulty. Since we did not have too many records in the dataset to begin with, we chose not to prune outliers (they do not seem to stand out distinctively). It will be interesting to see how the linear regression plots will change as we add more data from additional participants.
[1] Fitts, P. M. (1954). The information capacity of the human motor system in controlling the amplitude of movement. Journal of experimental psychology, 47(6), 381.
[2] MacKenzie, I. S. (1992). Fitts' law as a research and design tool in human-computer interaction. Human-computer interaction, 7(1), 91-139.
[3] Fitts, P. M., & Peterson, J. R. (1964). Information capacity of discrete motor responses. Journal of experimental psychology, 67(2), 103.
[4] Soukoreff, R. W., & MacKenzie, I. S. (2004). Towards a standard for pointing device evaluation, perspectives on 27 years of Fitts’ law research in HCI. International journal of human-computer studies, 61(6), 751-789.